AirROI Investment Analytics
Project Details

Overview & Team Collaboration
Developed for educational purposes through NC State's Institute for Advanced Analytics, this project was built using public data from AirROI, a platform that aggregates short-term rental metrics to market analytics tools for property investors. Operating as independent external consultants, my team was tasked with conducting an open-ended analysis of AirROI's regional datasets to build a sellable investment guide and dynamic pricing tools for aspiring Airbnb hosts. We have no formal relationship with or endorsement from AirROI.
We structured our analysis around three guiding questions:
- Where & Why? – Identifying geographical hotspots with the highest revenue potential relative to hotels.
- What to Optimize? – Quantifying the nightly rate premiums of specific amenities and booking attributes.
- How to Price & Market? – Designing a machine learning model to dynamically predict prices and assessing the visual quality of listing photography.
Methodology & Machine Learning
Our team developed three core analytics pipelines:
- Hotel vs. Airbnb Benchmarking: Compared comparable Airbnb listings (≤ 4 guests, ≤ 2 beds, 1 bath) against local Federal Per Diem (FPD) Lodging Rates (Hilton-equivalents) to classify markets as Hotel-Competitive (e.g. Raleigh, Durham) or Desirable Hotspots (e.g. Gatlinburg, Carolina Beach).
- Spatial Neighborhood Modeling (KNN): Designed a K=5 K-Nearest Neighbors spatial model using spherical
haversinedistance to calculate spatial lags and map localized revenue hotspot zones. - XGBoost Dynamic Pricing Model: Engineered a feature-driven model with 300+ columns (cancellation policies, booking options, seasonal variables) and text/image vector embeddings. We selected an XGBoost Regressor with a Log-Link Gamma objective to handle the skewed distribution of nightly rates.
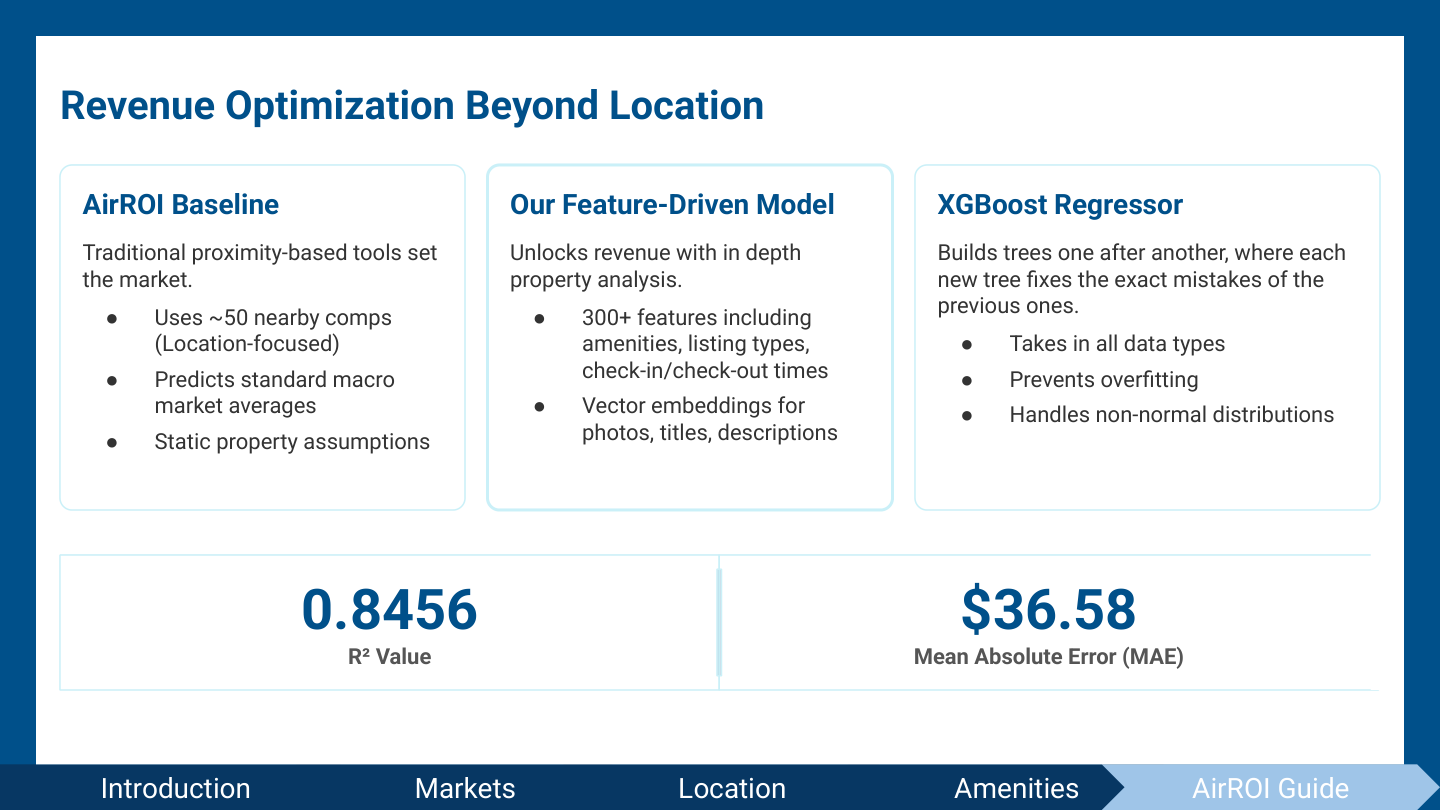
Our champion model achieved a Mean Absolute Error (MAE) of $36.58 and an R² score of 0.8456, capturing 85% of the pricing variance across the sub-markets.
Key Findings & Actionable Insights
1. Booking Attributes & Price Premiums
We isolated how operational listing attributes directly impact average daily rates (ADR):
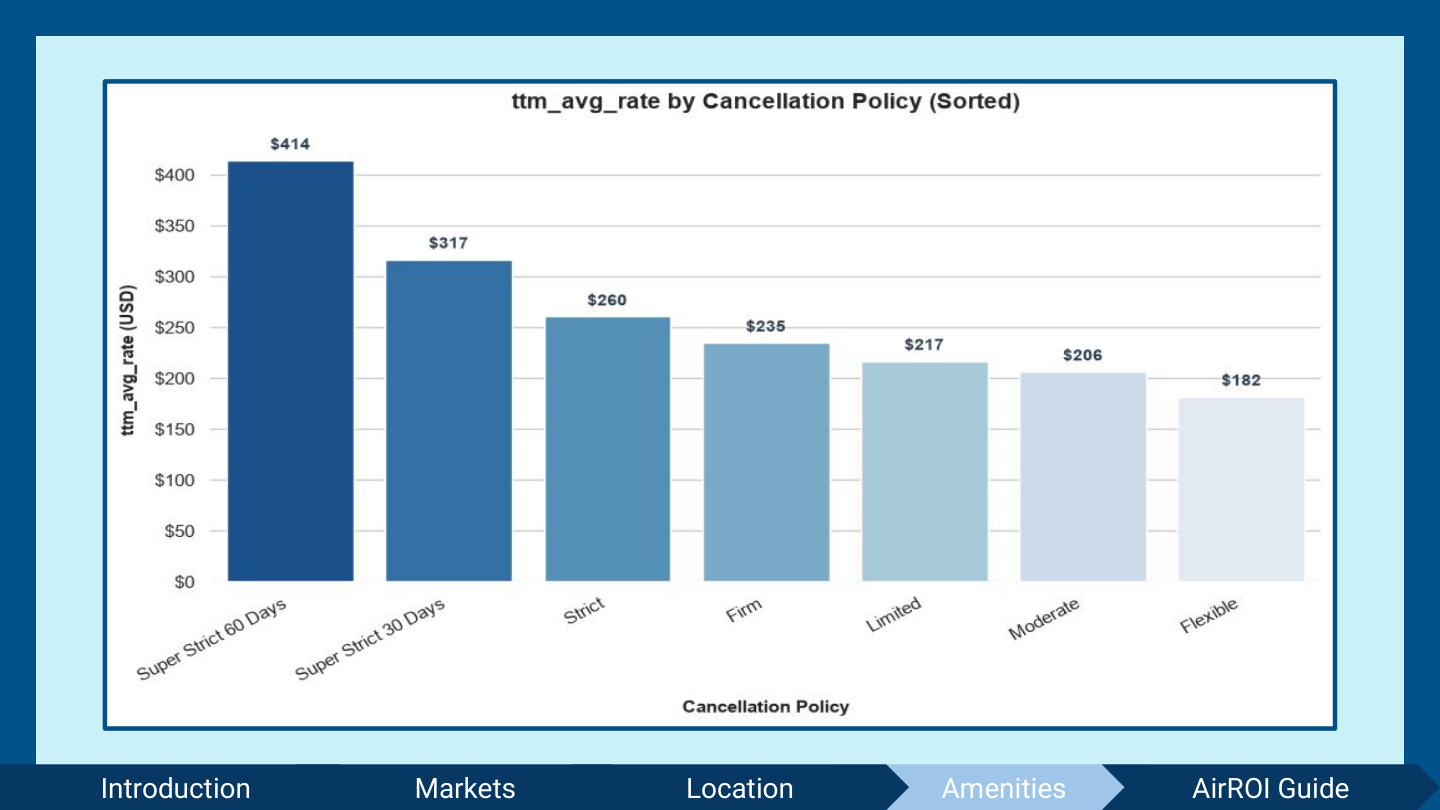
- Strict Cancellation Policies: Stricter policies correlated with higher nightly rates. Super Strict 60-day policies command an average of $414/night compared to Firm ($235) and Flexible ($182) policies.
- Instant Booking: Removing booking friction yielded a significant $88/night premium ($306/night for Instant Book vs. $218/night for Request to Book).
- Pets Allowed: Allowing pets drove a +$26/night premium ($255 vs $229).
- Superhost Status: Regular hosts averaged higher nightly rates ($274/night vs. $214/night for Superhosts), indicating that Superhosts prioritize high occupancy and review accumulation over top-dollar nightly pricing.
2. Photography & Cover Photo Residual Analysis
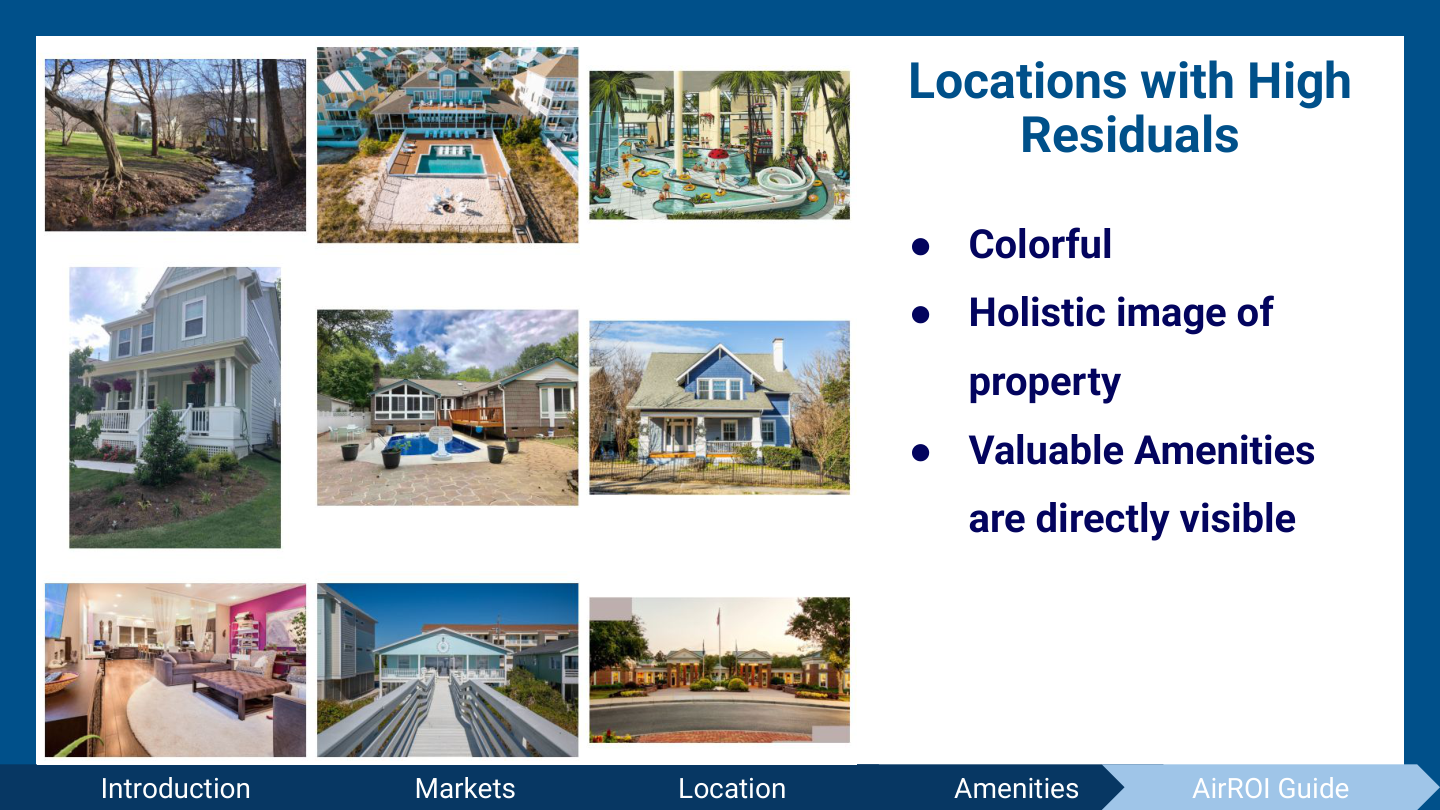
By analyzing our model's pricing residuals (Residual = Actual - Predicted), we isolated the visual factors that cause listings to overperform or underperform expectations:
- Overperforming (High Residuals): Characterized by a strong "color pop," high-quality lighting, and cover photos that show a holistic view of the property or clearly highlight premium amenities (like private pools and hot tubs).
- Underperforming (Low Residuals): Associated with dim lighting, generic stock resort images, and poor framing (e.g., cut-off furniture or empty forest views).
Interactive Dashboards
To put these tools in the hands of investors, we created two interactive Streamlit applications. You can access the live dashboards using the links below:
- Market Spatial Analysis Dashboard: Visualizes K=5 nearest-neighbor pricing spheres and lets investors zoom into specific sub-market coordinates to locate high-performing micro-locations.
- Amenities & Attributes Impact Dashboard: Lets hosts filter by bedrooms and bathrooms to isolate the exact dollar rate difference and saturation rate of specific amenities.
Live Interactive Dashboards
Market Spatial Analysis
Explore localized K = 5 nearest-neighbor pricing spheres and identify investment hotspots in individual sub-markets.
Amenities & Attributes Impact
Evaluate the nightly rate premiums, counts, and saturation rates of specific rental amenities and logical listing attributes.